2025 WXTM Price Prediction: Analyzing Market Trends and Potential Growth Factors
Introduction: WXTM's Market Position and Investment Value
MinoTari (WXTM), as a Layer 1 blockchain protocol built in Rust, has been making waves since its inception. As of 2025, WXTM's market capitalization has reached $4,496,826, with a circulating supply of approximately 1,578,387,820 tokens, and a price hovering around $0.002849. This asset, often referred to as an "ingenious approach to scaling", is playing an increasingly crucial role in blockchain scalability and app distribution.
This article will comprehensively analyze WXTM's price trends from 2025 to 2030, combining historical patterns, market supply and demand, ecosystem development, and macroeconomic environment to provide investors with professional price predictions and practical investment strategies.
I. WXTM Price History Review and Current Market Status
WXTM Historical Price Evolution
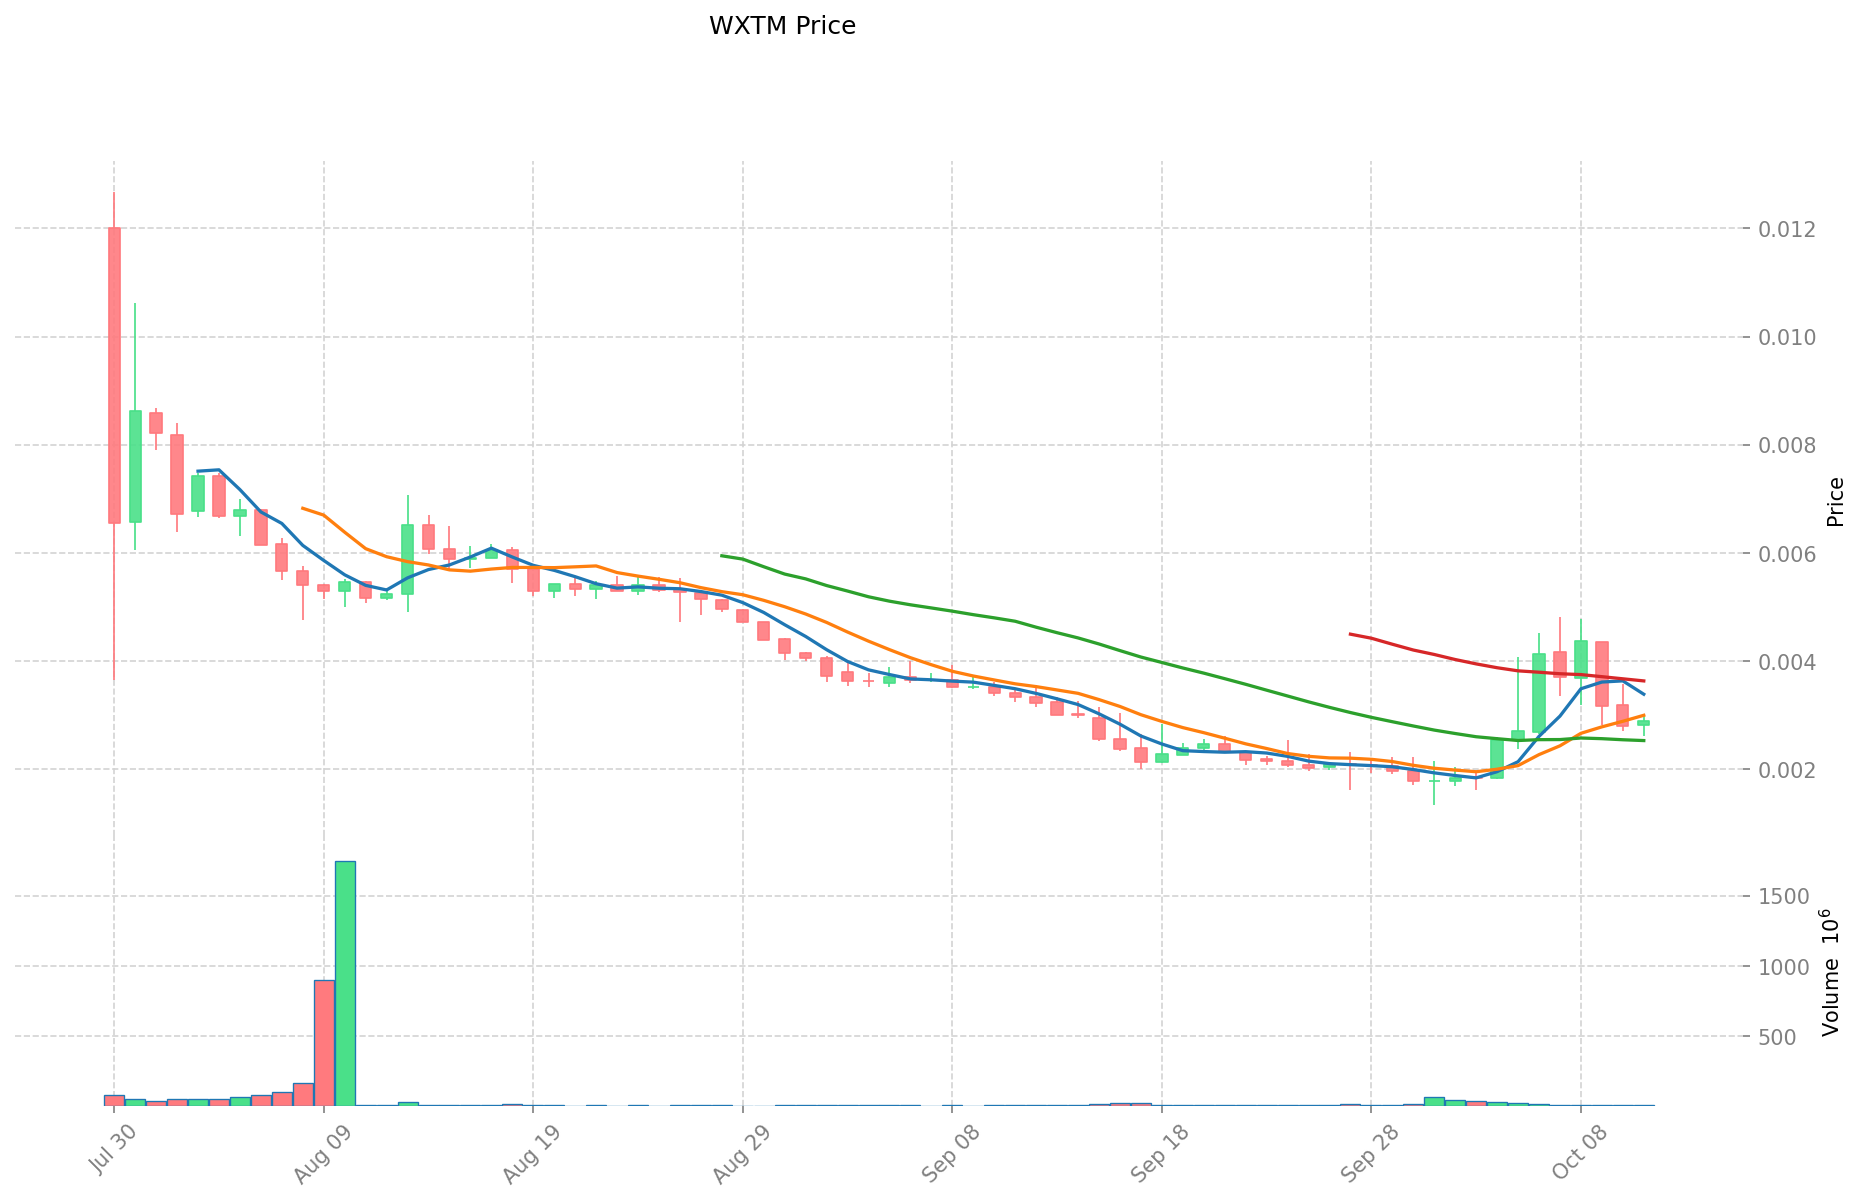
- 2025: WXTM reached its all-time high of $0.012681 on July 30
- 2025: The token hit its all-time low of $0.001319 on October 1
- 2025: WXTM experienced significant price fluctuations within a short period
WXTM Current Market Situation
As of October 12, 2025, WXTM is trading at $0.002849. The token has shown a positive 24-hour price change of 3.18%, with a trading volume of $12,771.67. WXTM's market capitalization stands at $4,496,826.89, ranking it at 1790 in the cryptocurrency market.
The token has demonstrated strong short-term performance with a 7-day price increase of 20.57%. However, it has experienced a decline of 14.44% over the past 30 days. The current price is significantly lower than its all-time high, suggesting potential for growth if market conditions improve.
WXTM's circulating supply is 1,578,387,820 tokens, which represents 7.52% of its total supply of 21,000,000,000. The fully diluted valuation of the project is $59,829,000.
Click to view the current WXTM market price
WXTM Market Sentiment Indicator
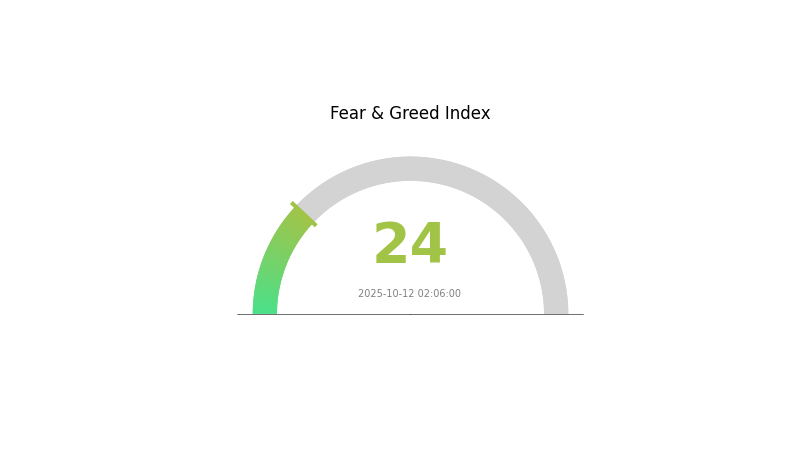
2025-10-12 Fear and Greed Index: 24 (Extreme Fear)
Click to view the current Fear & Greed Index
The crypto market is currently gripped by extreme fear, with the sentiment index plummeting to 24. This level of apprehension often signals a potential buying opportunity for contrarian investors. However, it's crucial to exercise caution and conduct thorough research before making any investment decisions. Remember, market sentiment can shift rapidly, and past performance doesn't guarantee future results. Stay informed and consider diversifying your portfolio to mitigate risks in these uncertain times.
WXTM Holdings Distribution
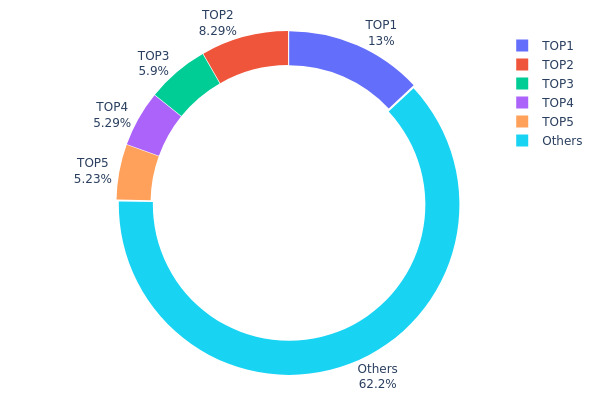
The address holdings distribution data provides insight into the concentration of WXTM tokens among different wallet addresses. Analysis of this data reveals a moderately concentrated distribution pattern for WXTM. The top 5 addresses collectively hold 37.73% of the total supply, with the largest single address controlling 13.04%.
While this level of concentration is notable, it does not necessarily indicate extreme centralization. The majority of tokens (62.27%) are distributed among numerous other addresses, suggesting a degree of decentralization. However, the significant holdings of the top addresses could potentially influence market dynamics. Large movements from these wallets might impact price volatility or liquidity.
This distribution structure implies a balanced market with both major players and a diverse base of smaller holders. It reflects a developing ecosystem where early adopters or project-related wallets may still hold substantial portions, while allowing for broader market participation. Ongoing monitoring of these holdings will be crucial to assess the evolving decentralization and stability of the WXTM network.
Click to view the current WXTM Holdings Distribution
| Top | Address | Holding Qty | Holding (%) |
|---|---|---|---|
| 1 | 0x5ade...ff34f5 | 73968.31K | 13.04% |
| 2 | 0xe92e...c5a03f | 47000.00K | 8.28% |
| 3 | 0x736e...8e95ec | 33452.70K | 5.89% |
| 4 | 0x049f...6cd635 | 30000.00K | 5.29% |
| 5 | 0x0d07...b492fe | 29662.46K | 5.23% |
| - | Others | 353020.88K | 62.27% |
II. Key Factors Affecting the Future Price of WXTM
Supply Mechanism
- Token Burning: WXTM may implement a token burning mechanism similar to BNB, which could impact its future price by reducing the overall supply.
- Current Impact: The potential implementation of a token burning mechanism could create upward pressure on WXTM's price due to reduced supply.
Macroeconomic Environment
- Inflation Hedging Properties: As seen with other cryptocurrencies, WXTM may be viewed as a potential hedge against inflation in certain economic conditions.
Technological Development and Ecosystem Building
- Network Upgrades: Future technological enhancements and network upgrades could significantly influence WXTM's price trajectory.
- Ecosystem Applications: The development of DApps and ecosystem projects on the WXTM network could drive adoption and potentially impact its value.
III. WXTM Price Prediction for 2025-2030
2025 Outlook
- Conservative prediction: $0.00259 - $0.00285
- Neutral prediction: $0.00285 - $0.00326
- Optimistic prediction: $0.00326 - $0.00368 (requires positive market sentiment and project developments)
2027-2028 Outlook
- Market phase expectation: Potential growth phase with increased adoption
- Price range forecast:
- 2027: $0.00298 - $0.00448
- 2028: $0.00235 - $0.00553
- Key catalysts: Technological advancements, expanding use cases, and overall crypto market trends
2029-2030 Long-term Outlook
- Base scenario: $0.00483 - $0.00538 (assuming steady market growth and project development)
- Optimistic scenario: $0.00538 - $0.00619 (with accelerated adoption and favorable market conditions)
- Transformative scenario: $0.00619+ (under extremely favorable conditions and breakthrough innovations)
- 2030-12-31: WXTM $0.00619 (potential peak based on optimistic projections)
| 年份 | 预测最高价 | 预测平均价格 | 预测最低价 | 涨跌幅 |
|---|---|---|---|---|
| 2025 | 0.00368 | 0.00285 | 0.00259 | 0 |
| 2026 | 0.00427 | 0.00326 | 0.00274 | 14 |
| 2027 | 0.00448 | 0.00377 | 0.00298 | 32 |
| 2028 | 0.00553 | 0.00413 | 0.00235 | 44 |
| 2029 | 0.00594 | 0.00483 | 0.00405 | 69 |
| 2030 | 0.00619 | 0.00538 | 0.00484 | 88 |
IV. WXTM Professional Investment Strategy and Risk Management
WXTM Investment Methodology
(1) Long-term Holding Strategy
- Suitable for: Long-term investors and believers in Tari technology
- Operation suggestions:
- Accumulate WXTM tokens during market dips
- Monitor Tari project developments and milestones
- Store tokens in a secure hardware wallet
(2) Active Trading Strategy
- Technical analysis tools:
- Moving Averages: Use to identify trends and potential reversal points
- Relative Strength Index (RSI): Determine overbought or oversold conditions
- Key points for swing trading:
- Set clear entry and exit points based on technical indicators
- Maintain strict stop-loss orders to limit potential losses
WXTM Risk Management Framework
(1) Asset Allocation Principles
- Conservative investors: 1-3% of crypto portfolio
- Aggressive investors: 5-10% of crypto portfolio
- Professional investors: Up to 15% of crypto portfolio
(2) Risk Hedging Solutions
- Diversification: Spread investments across multiple cryptocurrencies
- Stop-loss orders: Implement to limit potential losses
(3) Secure Storage Solutions
- Hot wallet recommendation: Gate web3 wallet
- Cold storage solution: Hardware wallet for long-term holdings
- Security precautions: Use two-factor authentication, avoid sharing private keys
V. WXTM Potential Risks and Challenges
WXTM Market Risks
- High volatility: WXTM price may experience significant fluctuations
- Limited liquidity: Trading volume may be low, affecting entry and exit
- Market sentiment: Susceptible to overall crypto market trends
WXTM Regulatory Risks
- Uncertain regulations: Cryptocurrency regulations may impact WXTM's usage and value
- Compliance challenges: Potential difficulties in adhering to evolving regulatory requirements
- Cross-border restrictions: Possible limitations on international transactions
WXTM Technical Risks
- Smart contract vulnerabilities: Potential issues with the ERC20 token contract
- Network congestion: Ethereum network issues may affect WXTM transactions
- Integration challenges: Potential difficulties in integrating with other platforms or services
VI. Conclusion and Action Recommendations
WXTM Investment Value Assessment
WXTM represents a high-risk, high-potential investment in the Tari ecosystem. Long-term value depends on Tari's success in scaling and attracting users, while short-term risks include market volatility and limited adoption.
WXTM Investment Recommendations
✅ Beginners: Consider small, experimental investments to understand the market ✅ Experienced investors: Allocate a portion of portfolio based on risk tolerance, monitor project developments ✅ Institutional investors: Conduct thorough due diligence, consider strategic partnerships with Tari
WXTM Trading Participation Methods
- Spot trading: Buy and sell WXTM on Gate.com
- DeFi participation: Explore potential liquidity provision or yield farming opportunities
- Long-term holding: Accumulate and store WXTM in secure wallets for potential future growth
Cryptocurrency investments carry extremely high risks, and this article does not constitute investment advice. Investors should make decisions carefully based on their own risk tolerance and are advised to consult professional financial advisors. Never invest more than you can afford to lose.
FAQ
Will XLM skyrocket price prediction?
XLM's price may rise significantly by 2025, driven by increased adoption and market trends. However, precise predictions are challenging in the volatile crypto market.
What crypto has the highest price prediction?
Bitcoin has the highest price prediction, forecasted to reach $139,249 at its peak. Chainlink follows with a predicted high of $59.67.
What is the price prediction for XRP in 2030?
By 2030, XRP is predicted to reach a price range of $90 to $120, marking a significant milestone in its growth trajectory.
What is the secret coin price prediction for 2030?
Based on current market trends, Secret (ERC20) is predicted to reach $1.08 by 2030, representing a 151.61% increase from current levels.
Share
Content