MORE vs ENJ: Comparing Two Leading Blockchain Gaming Tokens
Introduction: Investment Comparison of MORE vs ENJ
In the cryptocurrency market, the comparison between Moonveil (MORE) and Enjin Coin (ENJ) has been an unavoidable topic for investors. The two not only show significant differences in market cap ranking, application scenarios, and price performance, but also represent different positioning in crypto assets.
Moonveil (MORE): Since its launch, it has gained market recognition for its full-stack Web3 gaming ecosystem combining original & third-party games, publishing, and L2 infrastructure.
Enjin Coin (ENJ): Launched in 2017, it has been hailed as a leading platform for blockchain-based gaming assets, becoming one of the most widely recognized cryptocurrencies in the gaming sector.
This article will comprehensively analyze the investment value comparison between MORE and ENJ, focusing on historical price trends, supply mechanisms, institutional adoption, technological ecosystems, and future predictions, attempting to answer the question investors care about most:
"Which is the better buy right now?"
I. Price History Comparison and Current Market Status
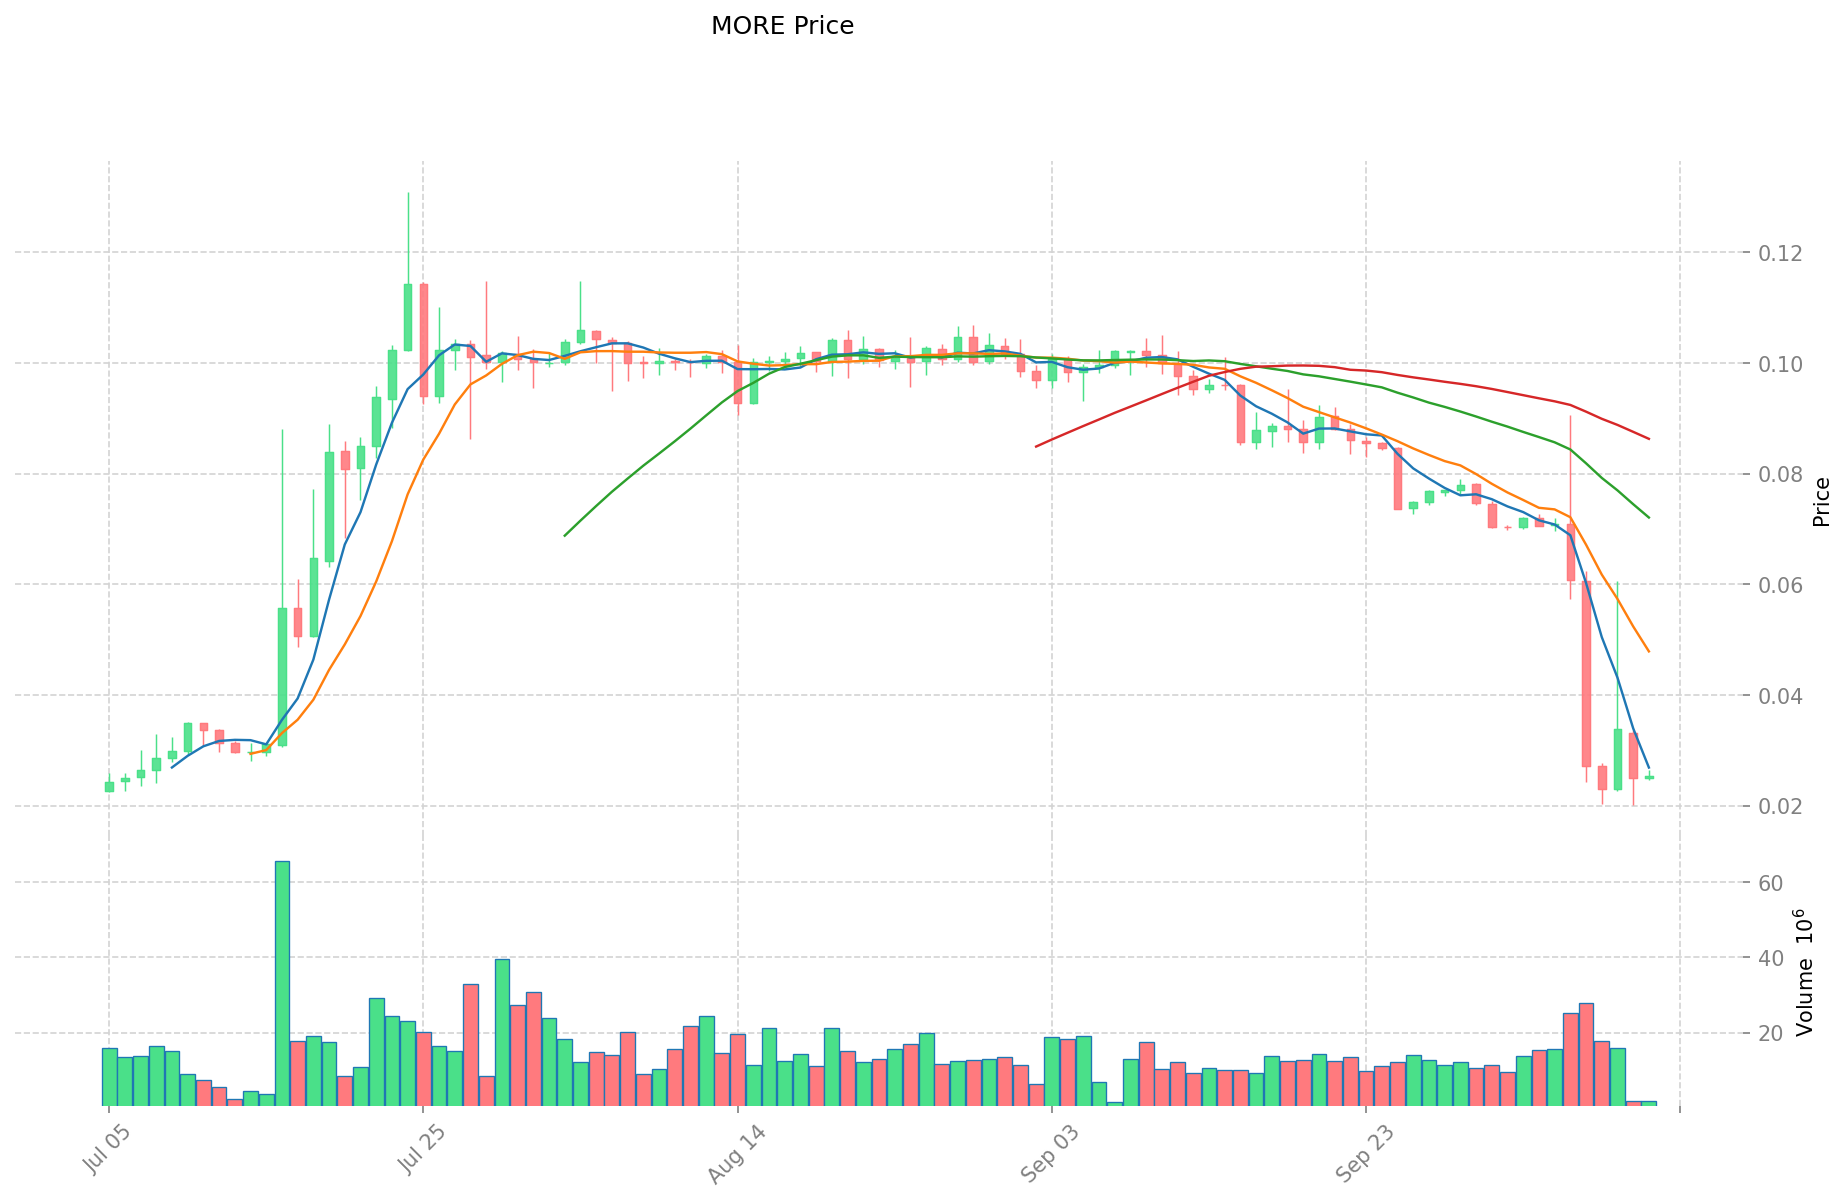
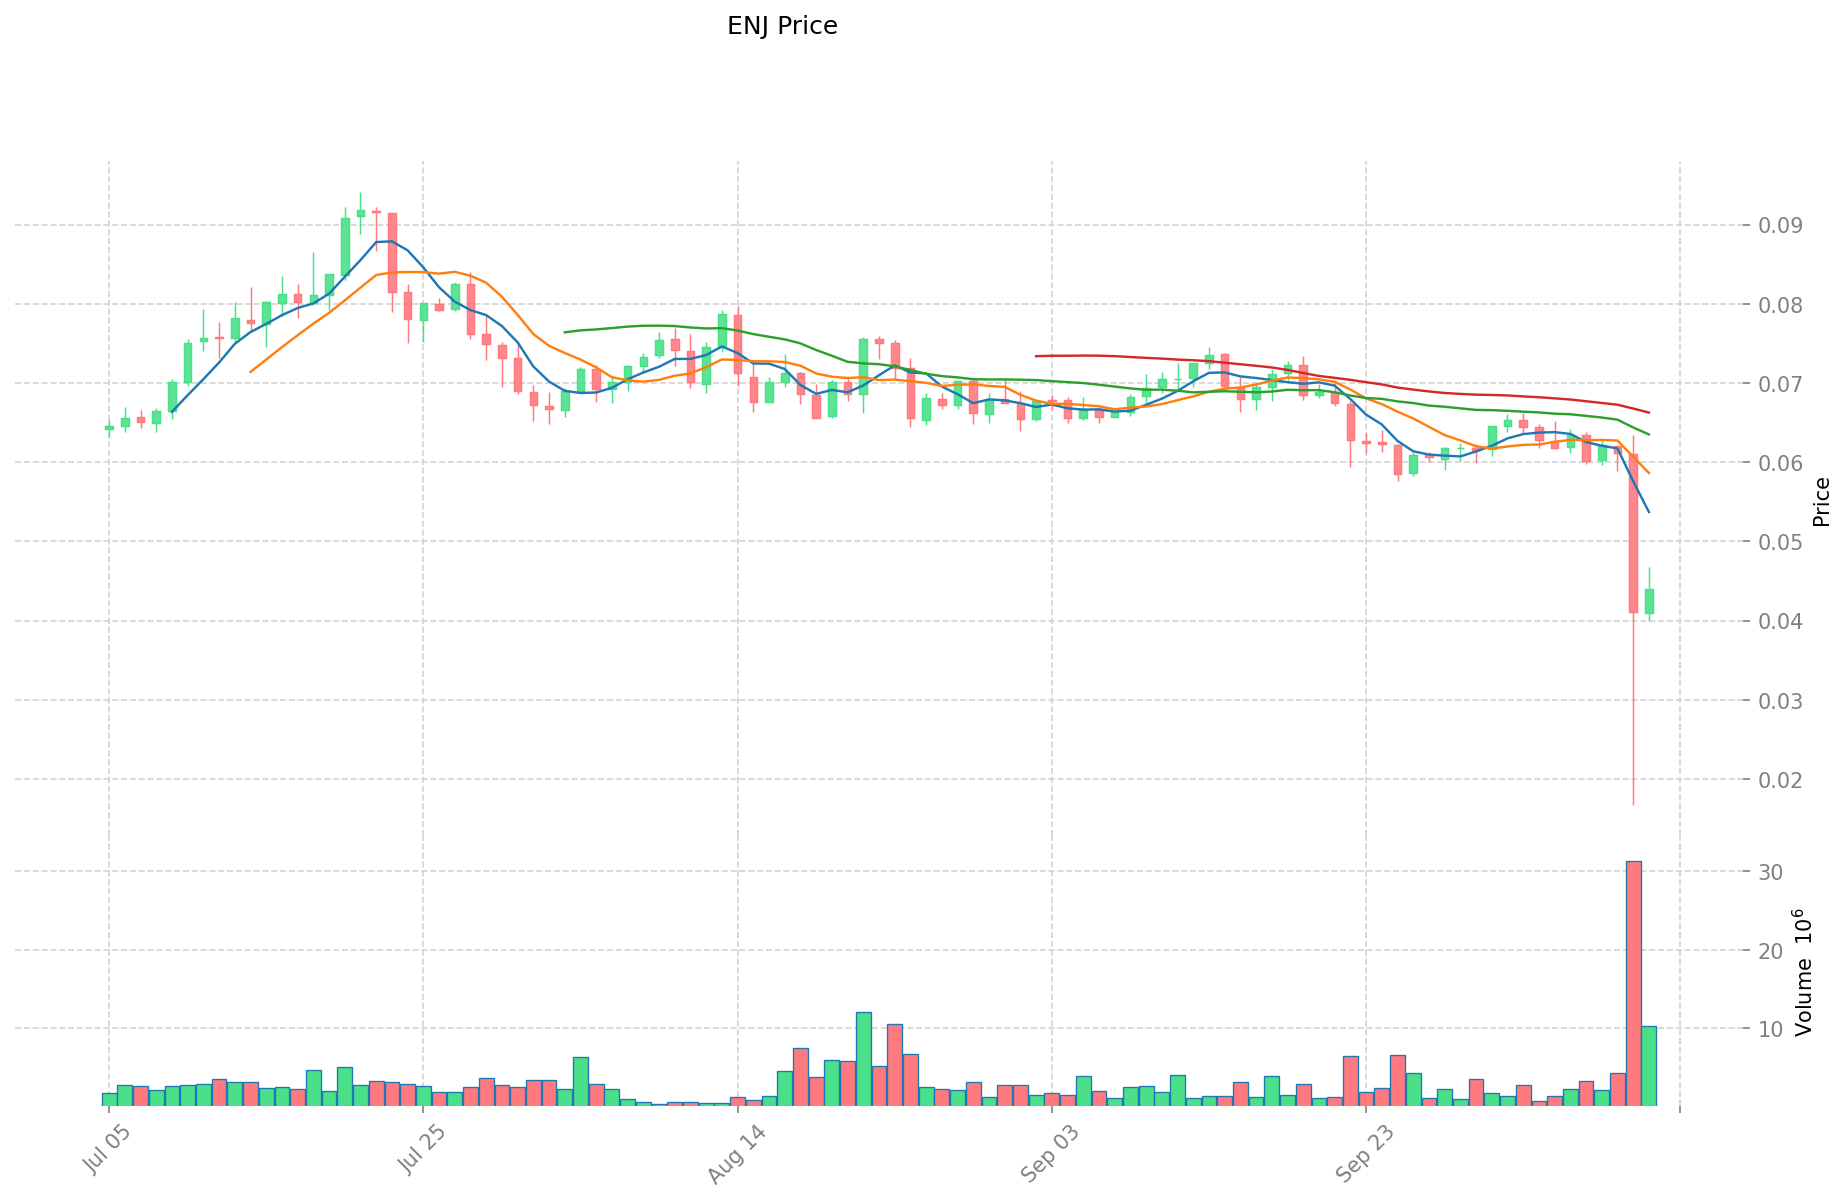
Moonveil (MORE) and Enjin Coin (ENJ) Historical Price Trends
- 2025: MORE launched with a node sale raising over $11 million, boosting its initial price performance.
- 2021: ENJ reached its all-time high of $4.82 on November 25, driven by the NFT boom.
- Comparative Analysis: In the recent market cycle, MORE dropped from its high of $0.22 to a low of $0.01518, while ENJ declined from its peak of $4.82 to current levels around $0.04395.
Current Market Situation (2025-10-12)
- MORE current price: $0.0253
- ENJ current price: $0.04395
- 24-hour trading volume: $47,908.72 (MORE) vs $445,219.13 (ENJ)
- Market Sentiment Index (Fear & Greed Index): 27 (Fear)
Click to view real-time prices:
- View MORE current price Market Price
- View ENJ current price Market Price
II. Core Factors Affecting ENJ Investment Value
Supply Mechanism (Tokenomics)
- ENJ: Features a fixed maximum supply of tokens on the Ethereum blockchain, supporting the tokenization of in-game items and digital assets
- 📌 Historical Pattern: The limited supply mechanism is designed to create scarcity as more tokens become locked in digital assets, potentially driving price appreciation over time.
Institutional Adoption and Market Applications
- Enterprise Adoption: ENJ provides a platform for game developers to tokenize in-game assets, creating unique interchangeable or non-interchangeable tokens on the Ethereum blockchain
- Market Integration: Growing integration within the blockchain gaming ecosystem as both a utility token and store of value for digital assets
Technical Development and Ecosystem Building
- ENJ Technical Innovation: Continuous development in blockchain gaming tokenization technology
- Ecosystem Comparison: Focused on NFT and gaming applications, with increasing integration possibilities across the broader blockchain gaming industry
Macroeconomic and Market Cycles
- Market Dynamics: ENJ price projections for 2025-2030 suggest growth potential tied to blockchain gaming token adoption
- Risk Factors: Investment value is contingent on broader market dynamics, technology innovation cycles, and mainstream adoption of blockchain gaming
III. 2025-2030 Price Prediction: MORE vs ENJ
Short-term Prediction (2025)
- MORE: Conservative $0.0206504 - $0.02488 | Optimistic $0.02488 - $0.0271192
- ENJ: Conservative $0.0359242 - $0.04381 | Optimistic $0.04381 - $0.0582673
Mid-term Prediction (2027)
- MORE may enter a growth phase, with prices expected between $0.02686278672 and $0.03453786864
- ENJ may enter a bullish market, with prices expected between $0.0538968144 and $0.079620294
- Key drivers: Institutional capital inflow, ETF developments, ecosystem growth
Long-term Prediction (2030)
- MORE: Base scenario $0.043800021268351 - $0.047096797062744 | Optimistic scenario $0.047096797062744 - $0.056045188504665
- ENJ: Base scenario $0.05625651492864 - $0.087900804576 | Optimistic scenario $0.087900804576 - $0.10635997353696
Disclaimer
MORE:
| 年份 | 预测最高价 | 预测平均价格 | 预测最低价 | 涨跌幅 |
|---|---|---|---|---|
| 2025 | 0.0271192 | 0.02488 | 0.0206504 | -1 |
| 2026 | 0.037959416 | 0.0259996 | 0.023659636 | 2 |
| 2027 | 0.03453786864 | 0.031979508 | 0.02686278672 | 26 |
| 2028 | 0.0462295767648 | 0.03325868832 | 0.0176271048096 | 31 |
| 2029 | 0.054449461583088 | 0.0397441325424 | 0.030205540732224 | 57 |
| 2030 | 0.056045188504665 | 0.047096797062744 | 0.043800021268351 | 86 |
ENJ:
| 年份 | 预测最高价 | 预测平均价格 | 预测最低价 | 涨跌幅 |
|---|---|---|---|---|
| 2025 | 0.0582673 | 0.04381 | 0.0359242 | 0 |
| 2026 | 0.07145411 | 0.05103865 | 0.03062319 | 16 |
| 2027 | 0.079620294 | 0.06124638 | 0.0538968144 | 39 |
| 2028 | 0.07606800396 | 0.070433337 | 0.06691167015 | 60 |
| 2029 | 0.102550938672 | 0.07325067048 | 0.0615305632032 | 66 |
| 2030 | 0.10635997353696 | 0.087900804576 | 0.05625651492864 | 100 |
IV. Investment Strategy Comparison: MORE vs ENJ
Long-term vs Short-term Investment Strategy
- MORE: Suitable for investors focused on Web3 gaming ecosystem potential
- ENJ: Suitable for investors interested in established blockchain gaming and NFT platforms
Risk Management and Asset Allocation
- Conservative investors: MORE: 30% vs ENJ: 70%
- Aggressive investors: MORE: 60% vs ENJ: 40%
- Hedging tools: Stablecoin allocation, options, cross-currency portfolios
V. Potential Risk Comparison
Market Risk
- MORE: Higher volatility due to newer market position
- ENJ: Exposure to fluctuations in the broader gaming and NFT markets
Technical Risk
- MORE: Scalability, network stability of new ecosystem
- ENJ: Platform adoption, smart contract vulnerabilities
Regulatory Risk
- Global regulatory policies may impact both tokens differently, with potential for increased scrutiny on gaming-related cryptocurrencies
VI. Conclusion: Which Is the Better Buy?
📌 Investment Value Summary:
- MORE advantages: Full-stack Web3 gaming ecosystem, potential for rapid growth
- ENJ advantages: Established presence in blockchain gaming, wider recognition
✅ Investment Advice:
- Novice investors: Consider a smaller allocation to MORE as part of a diversified portfolio
- Experienced investors: Balance between MORE and ENJ based on risk tolerance and market outlook
- Institutional investors: Evaluate both for potential inclusion in blockchain gaming sector exposure
⚠️ Risk Warning: The cryptocurrency market is highly volatile. This article does not constitute investment advice. None
VII. FAQ
Q1: What are the main differences between MORE and ENJ? A: MORE is a newer token focusing on a full-stack Web3 gaming ecosystem, while ENJ is an established platform for blockchain-based gaming assets. MORE has a lower market cap and higher volatility, whereas ENJ has wider recognition in the blockchain gaming sector.
Q2: Which token has shown better price performance recently? A: Based on the current data, ENJ is trading at a higher price ($0.04395) compared to MORE ($0.0253). However, recent performance should not be the sole factor in making investment decisions.
Q3: What are the key factors affecting the investment value of MORE and ENJ? A: Key factors include supply mechanisms, institutional adoption, technical development, ecosystem building, and overall market cycles. ENJ benefits from its established presence, while MORE offers potential growth in its new Web3 gaming ecosystem.
Q4: How do the long-term price predictions compare for MORE and ENJ? A: By 2030, MORE is predicted to reach $0.043800021268351 - $0.056045188504665, while ENJ is expected to reach $0.05625651492864 - $0.10635997353696 in the base to optimistic scenarios.
Q5: What are the main risks associated with investing in MORE and ENJ? A: Both tokens face market risks due to cryptocurrency volatility. MORE may have higher technical risks due to its newer ecosystem, while ENJ faces risks related to platform adoption. Both are subject to regulatory risks, particularly in the gaming-related cryptocurrency space.
Q6: How should investors allocate their portfolio between MORE and ENJ? A: Conservative investors might consider allocating 30% to MORE and 70% to ENJ, while more aggressive investors could opt for 60% MORE and 40% ENJ. However, individual allocations should be based on personal risk tolerance and market outlook.
Q7: Are MORE and ENJ suitable for all types of investors? A: MORE might be more suitable for investors interested in emerging Web3 gaming ecosystems and willing to take on higher risk. ENJ may be more appropriate for those interested in established blockchain gaming platforms. Novice investors should consider smaller allocations as part of a diversified portfolio.
Share
Content