How to Read Candlestick Charts? A Web3 Native’s Guide to Market Sentiment

7/21/2025, 7:37:26 AM
Beginner
Quick Reads
A candlestick chart presents price changes over a given period by highlighting four critical data points: the opening price, the highest price, the lowest price, and the closing price.

What Are Candlestick Charts?

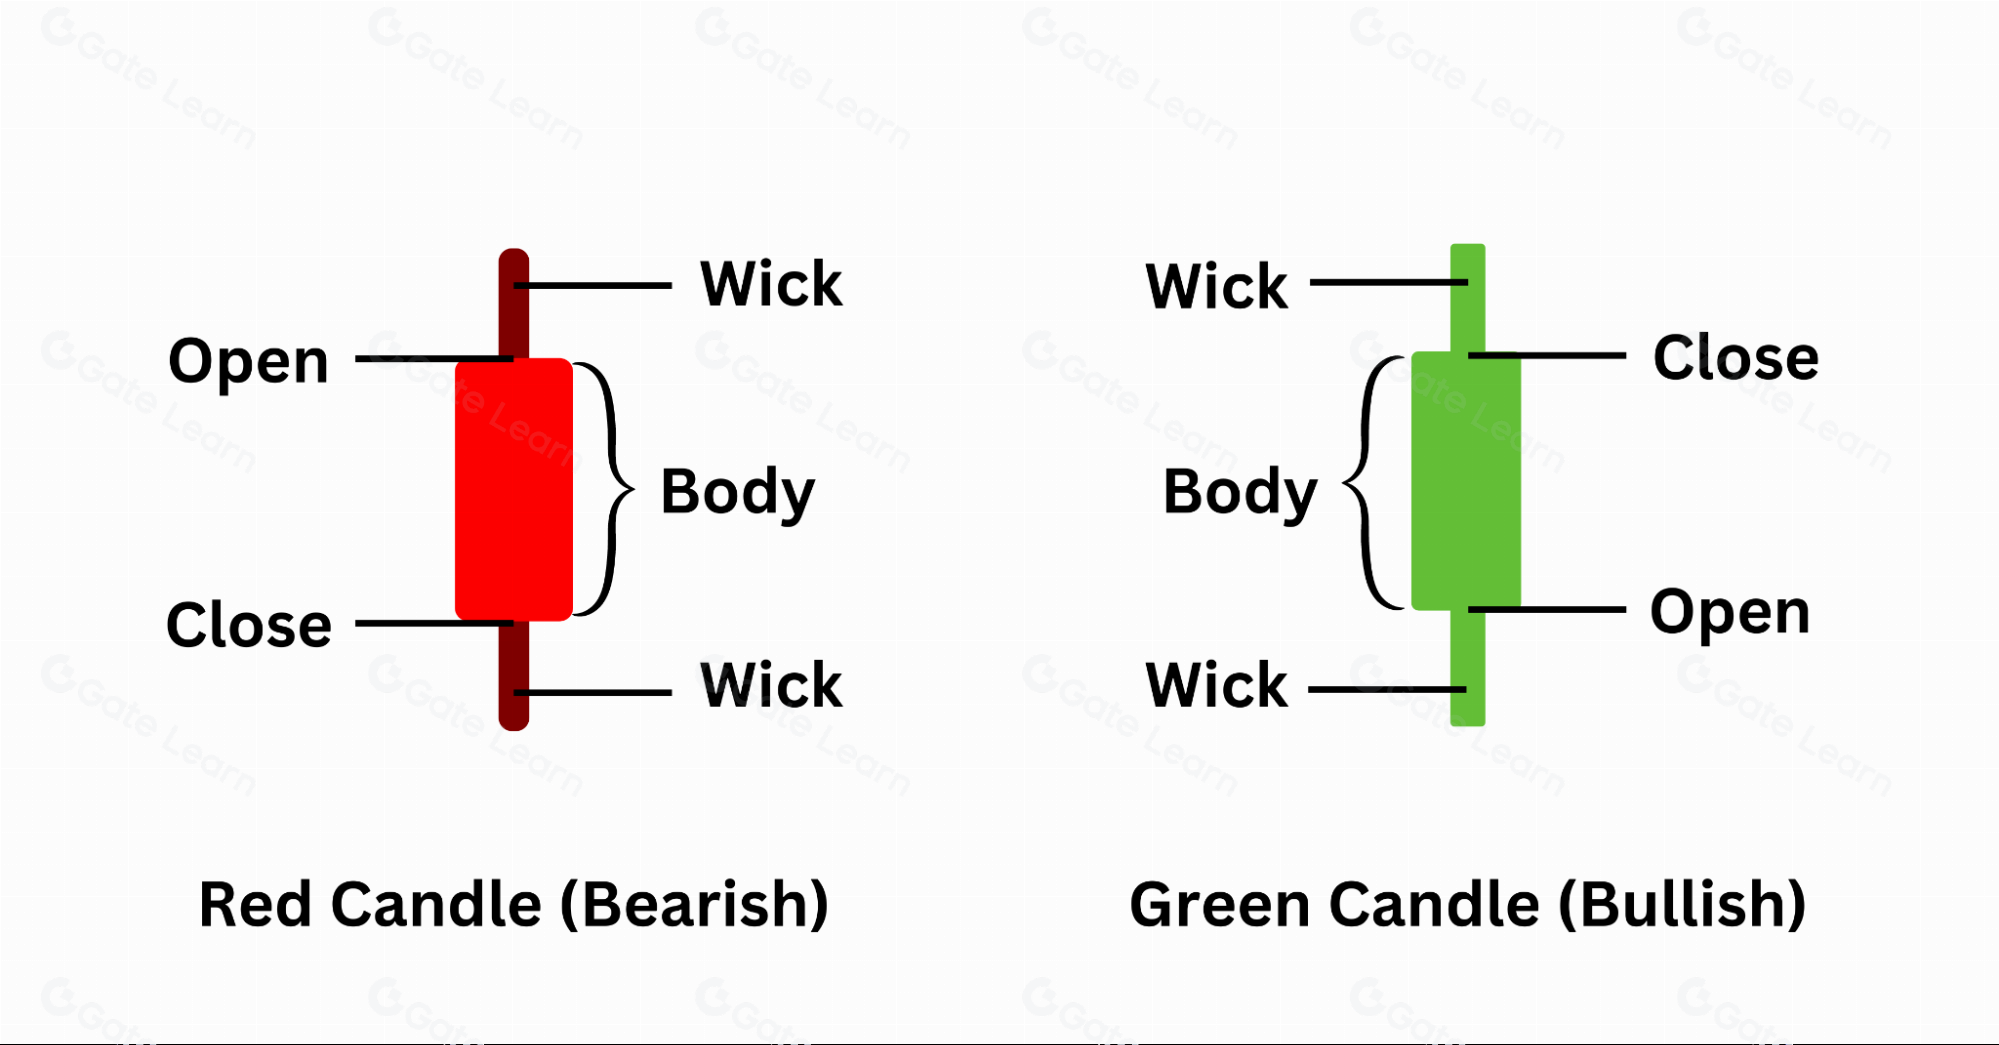
Candlestick charts originated in the rice markets of Japan’s Edo period and have become a standard tool in global financial markets. Each candlestick represents price movement over a specific time interval—such as one minute, one hour, one day, or one week. Each candlestick displays the following key data:

  • Open price
  • High price
  • Low price
  • Close price


(Basic structure of a candlestick chart)

These four prices define the structure of each candlestick:

  • Bullish candle (green): The close is above the open, indicating upward price movement.
  • Bearish candle (red): The close is below the open, indicating downward price movement.

The main portion of the candlestick, called the “body,” has thin lines above and below known as “wicks,” which show the full range of price fluctuations within the chosen period.

How to Interpret a Single Candlestick

For example:

  • If a bullish (green) candlestick has a long lower wick, it means that although the price dropped significantly during that period, buyers drove the price back up and it closed higher. This reflects strong bullish momentum and active buying interest.
  • If a bearish (red) candlestick has a particularly long upper wick, it indicates that prices rose but then declined due to strong selling pressure, resulting in a lower close and signaling bearish control.

The relative lengths of the wicks and the size of the body help traders distinguish between market indecision and potential trend reversals.

Decoding Common Candlestick Patterns

  1. Hammer: Features a long lower wick and a short body, typically appearing at the bottom of a downtrend. Indicates that buyers are entering the market and a rebound may follow.
  2. Shooting Star: Characterized by a long upper wick and a short body, often found at the top of an uptrend. Suggests weakening buying power and the possibility of a downward reversal.
  3. Engulfing Pattern: The body of the second candlestick completely engulfs that of the previous candlestick. This signals a strong potential trend reversal in the direction of the engulfing candle.
  4. Doji: The open and close prices are nearly identical. Indicates market indecision and a period of consolidation or a potential turning point.
  5. Three White Soldiers / Three Black Crows: Three consecutive bullish (green) or bearish (red) candlesticks. This pattern demonstrates a strong, sustained trend, but it may also precede a sharp reversal if momentum becomes excessive.
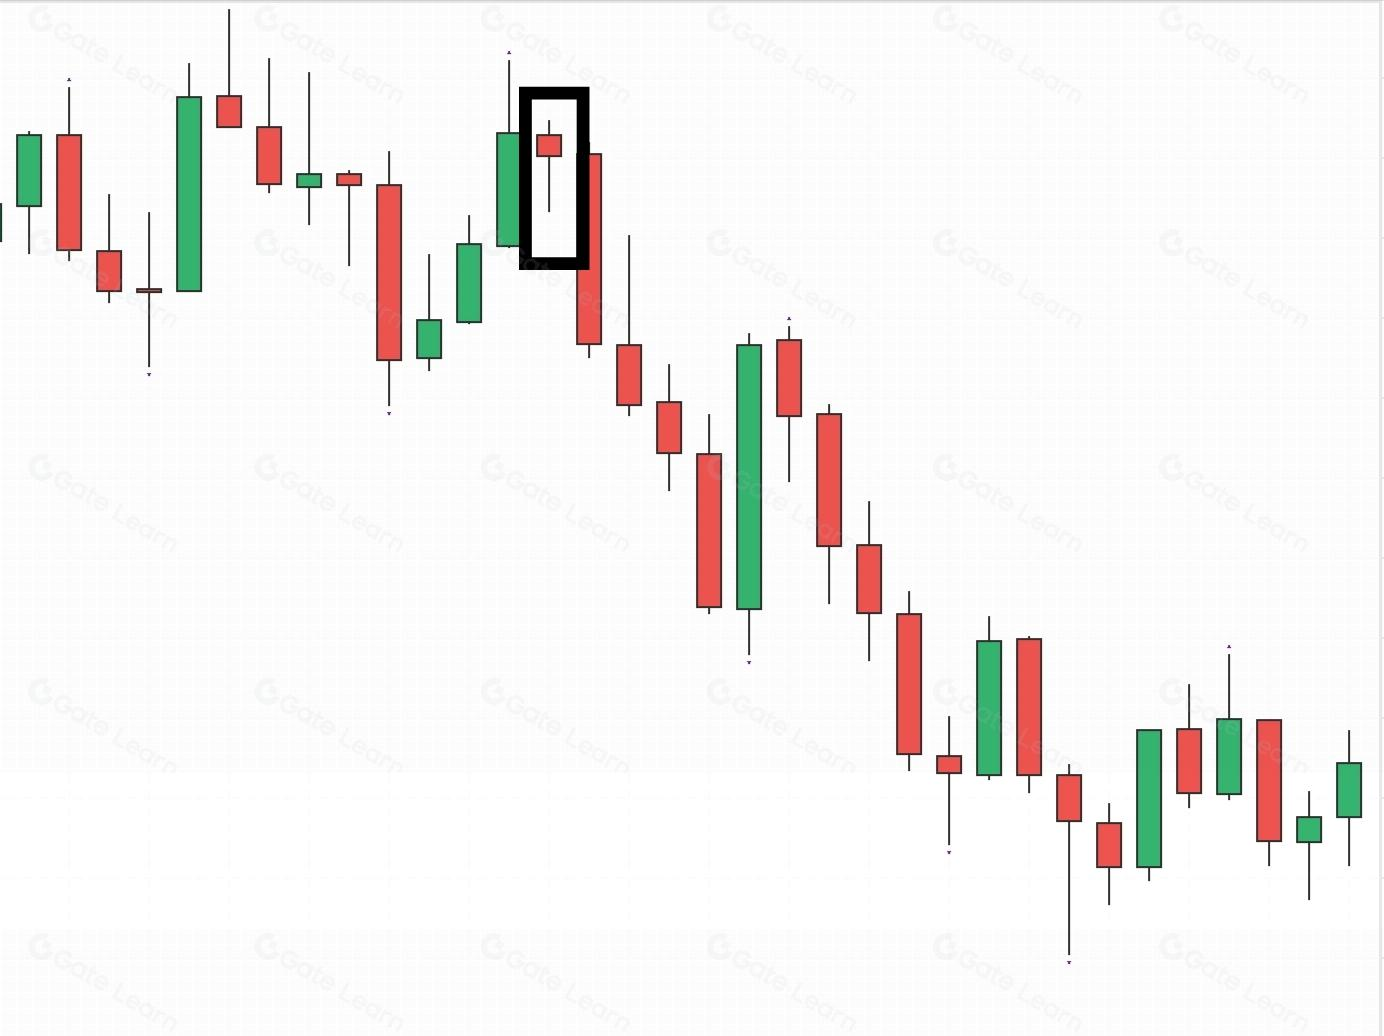

(Hammer pattern)

These patterns are not predictive guarantees; they are analytical tools that support probability-based trend assessment.

The Market Forces Behind Candlesticks

Analyzing candlestick charts alone can lead to overlooking the true strength behind price movements. Incorporating volume analysis provides deeper insight into whether trends have genuine trading support:

  • Rising price with increasing volume: Indicates robust bullish momentum and a healthy uptrend.
  • Falling price with declining volume: Suggests weak selling pressure, increasing the likelihood of a rebound.
  • Volume spikes at turning points: May signal major holders selling or accumulating positions, warranting closer attention.

In the Web3 market, especially for low-liquidity tokens, analyzing both volume and price is even more critical.

Effective Use of Different Timeframes

  • Daily/weekly charts: Suitable for identifying medium- and long-term trends and planning entry or exit strategies.
  • 4-hour/1-hour charts: Commonly used by swing traders to set stop-loss and take-profit levels.
  • 15-minute/5-minute candlesticks: Ideal for short-term or high-frequency traders to track capital flows.

Using multi-timeframe analysis can significantly improve your strategy’s success rate. For example:

  • Use the daily chart to identify the overall trend.
  • Use the 4-hour chart to find entry points.
  • Use the 15-minute chart to confirm reversal signals.

Common Pitfalls and Practical Strategies

  1. Candlestick charts record market behavior and help interpret current conditions—they do not predict the future.
  2. Avoid making trading decisions based on a single candlestick. Combine analysis of overall trends, volume, and pattern structures for a comprehensive strategy.
  3. Price action in small-cap or meme coins is easily manipulated. Verify breakout moves by cross-referencing on-chain data and transaction activity.
  4. Always implement risk management: Even with a strong view, set stop-loss orders to protect your capital from potential misjudgments.

To learn more about Web3 and digital assets, register now: https://www.gate.com/

Summary

Candlestick charts provide a comprehensive record of market sentiment, reflecting the ongoing dynamics between buyers and sellers. Whether you focus on NFTs, DeFi protocols, or Layer 2 solutions, the ability to interpret candlestick patterns is an essential skill in the Web3 ecosystem. Mastery of candlestick analysis enables market participants to discern underlying logic, sentiment, and rhythm beyond simple price fluctuations.

Author: Allen
* The information is not intended to be and does not constitute financial advice or any other recommendation of any sort offered or endorsed by Gate.
* This article may not be reproduced, transmitted or copied without referencing Gate. Contravention is an infringement of Copyright Act and may be subject to legal action.

Share

Crypto Calendar
Proje Güncellemeleri
Coinbase, 14 Ekim ile 17 Ekim tarihleri arasında tüm MATIC Token'larını POL'e yükseltecek. Göç süresince, MATIC Stake'lerinin ödülleri birikmeyecek.
POL
-1.74%
2025-10-14
Hackathon
Pi Network, Açık Ağ'ın debutundan sonra ilk büyük geliştirici zorluğu olan Pi Hackathon 2025'i resmi olarak başlattı. Bu hackathon, geliştiricileri gerçek dünya faydası sunan ve ekosistemi geliştirmeye yardımcı olan Pi destekli uygulamalar tasarlamaya ve başlatmaya davet ediyor - toplam ödül havuzu 160.000 Pi. Pi2Day 2025'ten gelen inovasyon momentumunu temel alarak, yarışma günlük kullanım araçlarından tamamen yeni uygulama kavramlarına kadar geniş bir yelpazede fayda odaklı fikirleri teşvik ediyor. Tüm başvurular Ana Ağ Listeleme Gereksinimlerini karşılamalı ve Pi topluluğuna somut değer sağlamalıdır. Teşvikler ve Ödüller: 1. Yer: 75.000 Pi 2. Yer: 45.000 Pi 3. Yer: 15.000 Pi 5 Onur Belgesi: 5.000 Pi her biri Ana Tarihler: 15 Ağustos: Kayıt açılır ve takım oluşturma başlar 21 Ağustos: Hackathon resmi olarak başlar 19 Eylül: Ara kontrol (isteğe bağlı, ancak mentorluk ve görünürlük sağlayabilir) 15 Ekim: Nihai başvurular, uygulama listeleme ve demo videosu dahil olmak üzere son tarih Geliştiricilerin, Pi App Studio, Brainstorm, Geliştirici Portalı ve açık kaynak kaynaklarını (PiOS) ile birlikte AI araçlarından yararlanmaları teşvik edilmektedir.
PI
-9.11%
2025-10-14
Hackathon
Starknet, 15 Eylül'de Re{solve} Hackathon'unun başladığını duyurdu, bu etkinlik bir ay sürecek ve ödül havuzu 50.000 $'dan fazla olacak. Katılımcıların pratik çözümler geliştirmeleri, bunları üretime geçirmeleri ve ödüller için yarışmaları teşvik edilmektedir.
STRK
-2.42%
2025-10-14
127MM Token Kilidi Açma
Starknet, tokenleri UTC 12:00'de açar.
STRK
-2.42%
2025-10-14
Token'ların Kilidini Aç
Sei, mevcut dolaşımdaki arzın yaklaşık %1,15'ini oluşturan 55.560.000 SEI token'ını 15 Ekim'de serbest bırakacaktır.
SEI
-2.22%
2025-10-14

Related Articles

Pi Coin Transaction Guide: How to Transfer to Gate.io
Beginner

Pi Coin Transaction Guide: How to Transfer to Gate.io

Pi Network is a decentralized cryptocurrency network for the general public, using the Stellar Consensus Protocol (SCP) consensus mechanism, which allows users to easily mine Pi tokens from their mobile devices and use them for payments and transactions. With the official opening of the mainnet on February 20, 2025, investors can deposit and trade $PI on exchanges such as Gate.io. This article details how to securely transfer Pi Coins to Gate.io, including obtaining a deposit address, completing the transfer using the Pi Network mainnet wallet, and the exchange's arrival confirmation process. In addition, we have analysed $PI investment risks, including market volatility, compliance and potential fraud risks, to remind investors to take risk management before trading.
2/25/2025, 8:21:43 AM
What is N2: An AI-Driven Layer 2 Solution
Beginner

What is N2: An AI-Driven Layer 2 Solution

This article introduces N2 (Niggachain AI Layer 2), the world's first AI-driven Layer 2 blockchain solution. N2 combines AI technology and quantum computing resistance to address the limitations of traditional blockchains in scalability, transaction speed, and cost. Its core technologies include '0-second block time', AI-driven network optimization, and quantum-resistant security protection, aiming to improve transaction efficiency and ensure system stability.
12/23/2024, 7:21:00 AM
Flare Crypto Explained: What Is Flare Network and Why It Matters in 2025
Beginner

Flare Crypto Explained: What Is Flare Network and Why It Matters in 2025

Discover what Flare Crypto is, how it works, its use cases, tokenomics, and why it's gaining traction in the blockchain space in 2025.
4/15/2025, 1:21:45 AM
How to Use a Crypto Whale Tracker: Top Tool Recommendation for 2025 to Follow Whale Moves
Beginner

How to Use a Crypto Whale Tracker: Top Tool Recommendation for 2025 to Follow Whale Moves

This article will take you through what is a crypto whale tracker and why it has become the "must-have weapon" for encryption investors. We will recommend seven mainstream Whale tracking tools, and combined with usage scenarios, teach you how to efficiently use these tools to obtain first-hand signals from the market. Of course, Whale behavior may also be a "lure," so while using these tools, you also need to have a certain level of judgment and data interpretation ability. This article is suitable for beginners to quickly get started, as well as for experienced players to optimize strategies.
4/14/2025, 6:57:17 AM
Understand Baby doge coin in one article
Beginner

Understand Baby doge coin in one article

Baby Doge Coin, also known as "Baby Dog Token", is a meme token derived from the Dogecoin community, which gained popularity through Elon Musk's tweets and enhanced token utility through mechanisms such as deflation, payment integration, and NFT ecosystem. This article comprehensively analyzes the project background, token information, application scenarios, and market performance of Baby Doge, helping investors quickly understand its potential and risks.
2/14/2025, 4:53:03 PM
How to Sell Pi Coin: A Beginner's Guide
Beginner

How to Sell Pi Coin: A Beginner's Guide

This article provides detailed information about Pi Coin, how to complete KYC verification, and choose the right exchange to sell Pi Coin. We also provide specific steps for selling Pi Coin and remind of important matters to pay attention to when selling, helping novice users complete Pi Coin transactions smoothly.
2/26/2025, 9:20:50 AM
Start Now
Sign up and get a
$100
Voucher!